Expert AP Statistics Tutors Online score 5/5 with Tychr
AP Statistics is one of the most intellectually demanding AP courses. Mastering its core methodologies and executing precise FRQ arguments require deliberate, expert-led structure practice.

GULIA
5/5

TANISHA
5/5

ADAA
5/5

RUSHIL
5/5

ESHAAN
5/5

VISHAAL
5/5
Start your journey with the right guidance.
Your information is kept private and never shared with third parties.
92%
Students score a 5/5
+1.8
Average score improvement
22+
AP subjects covered
4.9★
Average tutor rating
94% of Graduates Secure Admissions into the Top 50 Global Universities
Meet the brilliant minds who transformed their testing potential into world-class AP scores and elite Ivy League academic portfolios.
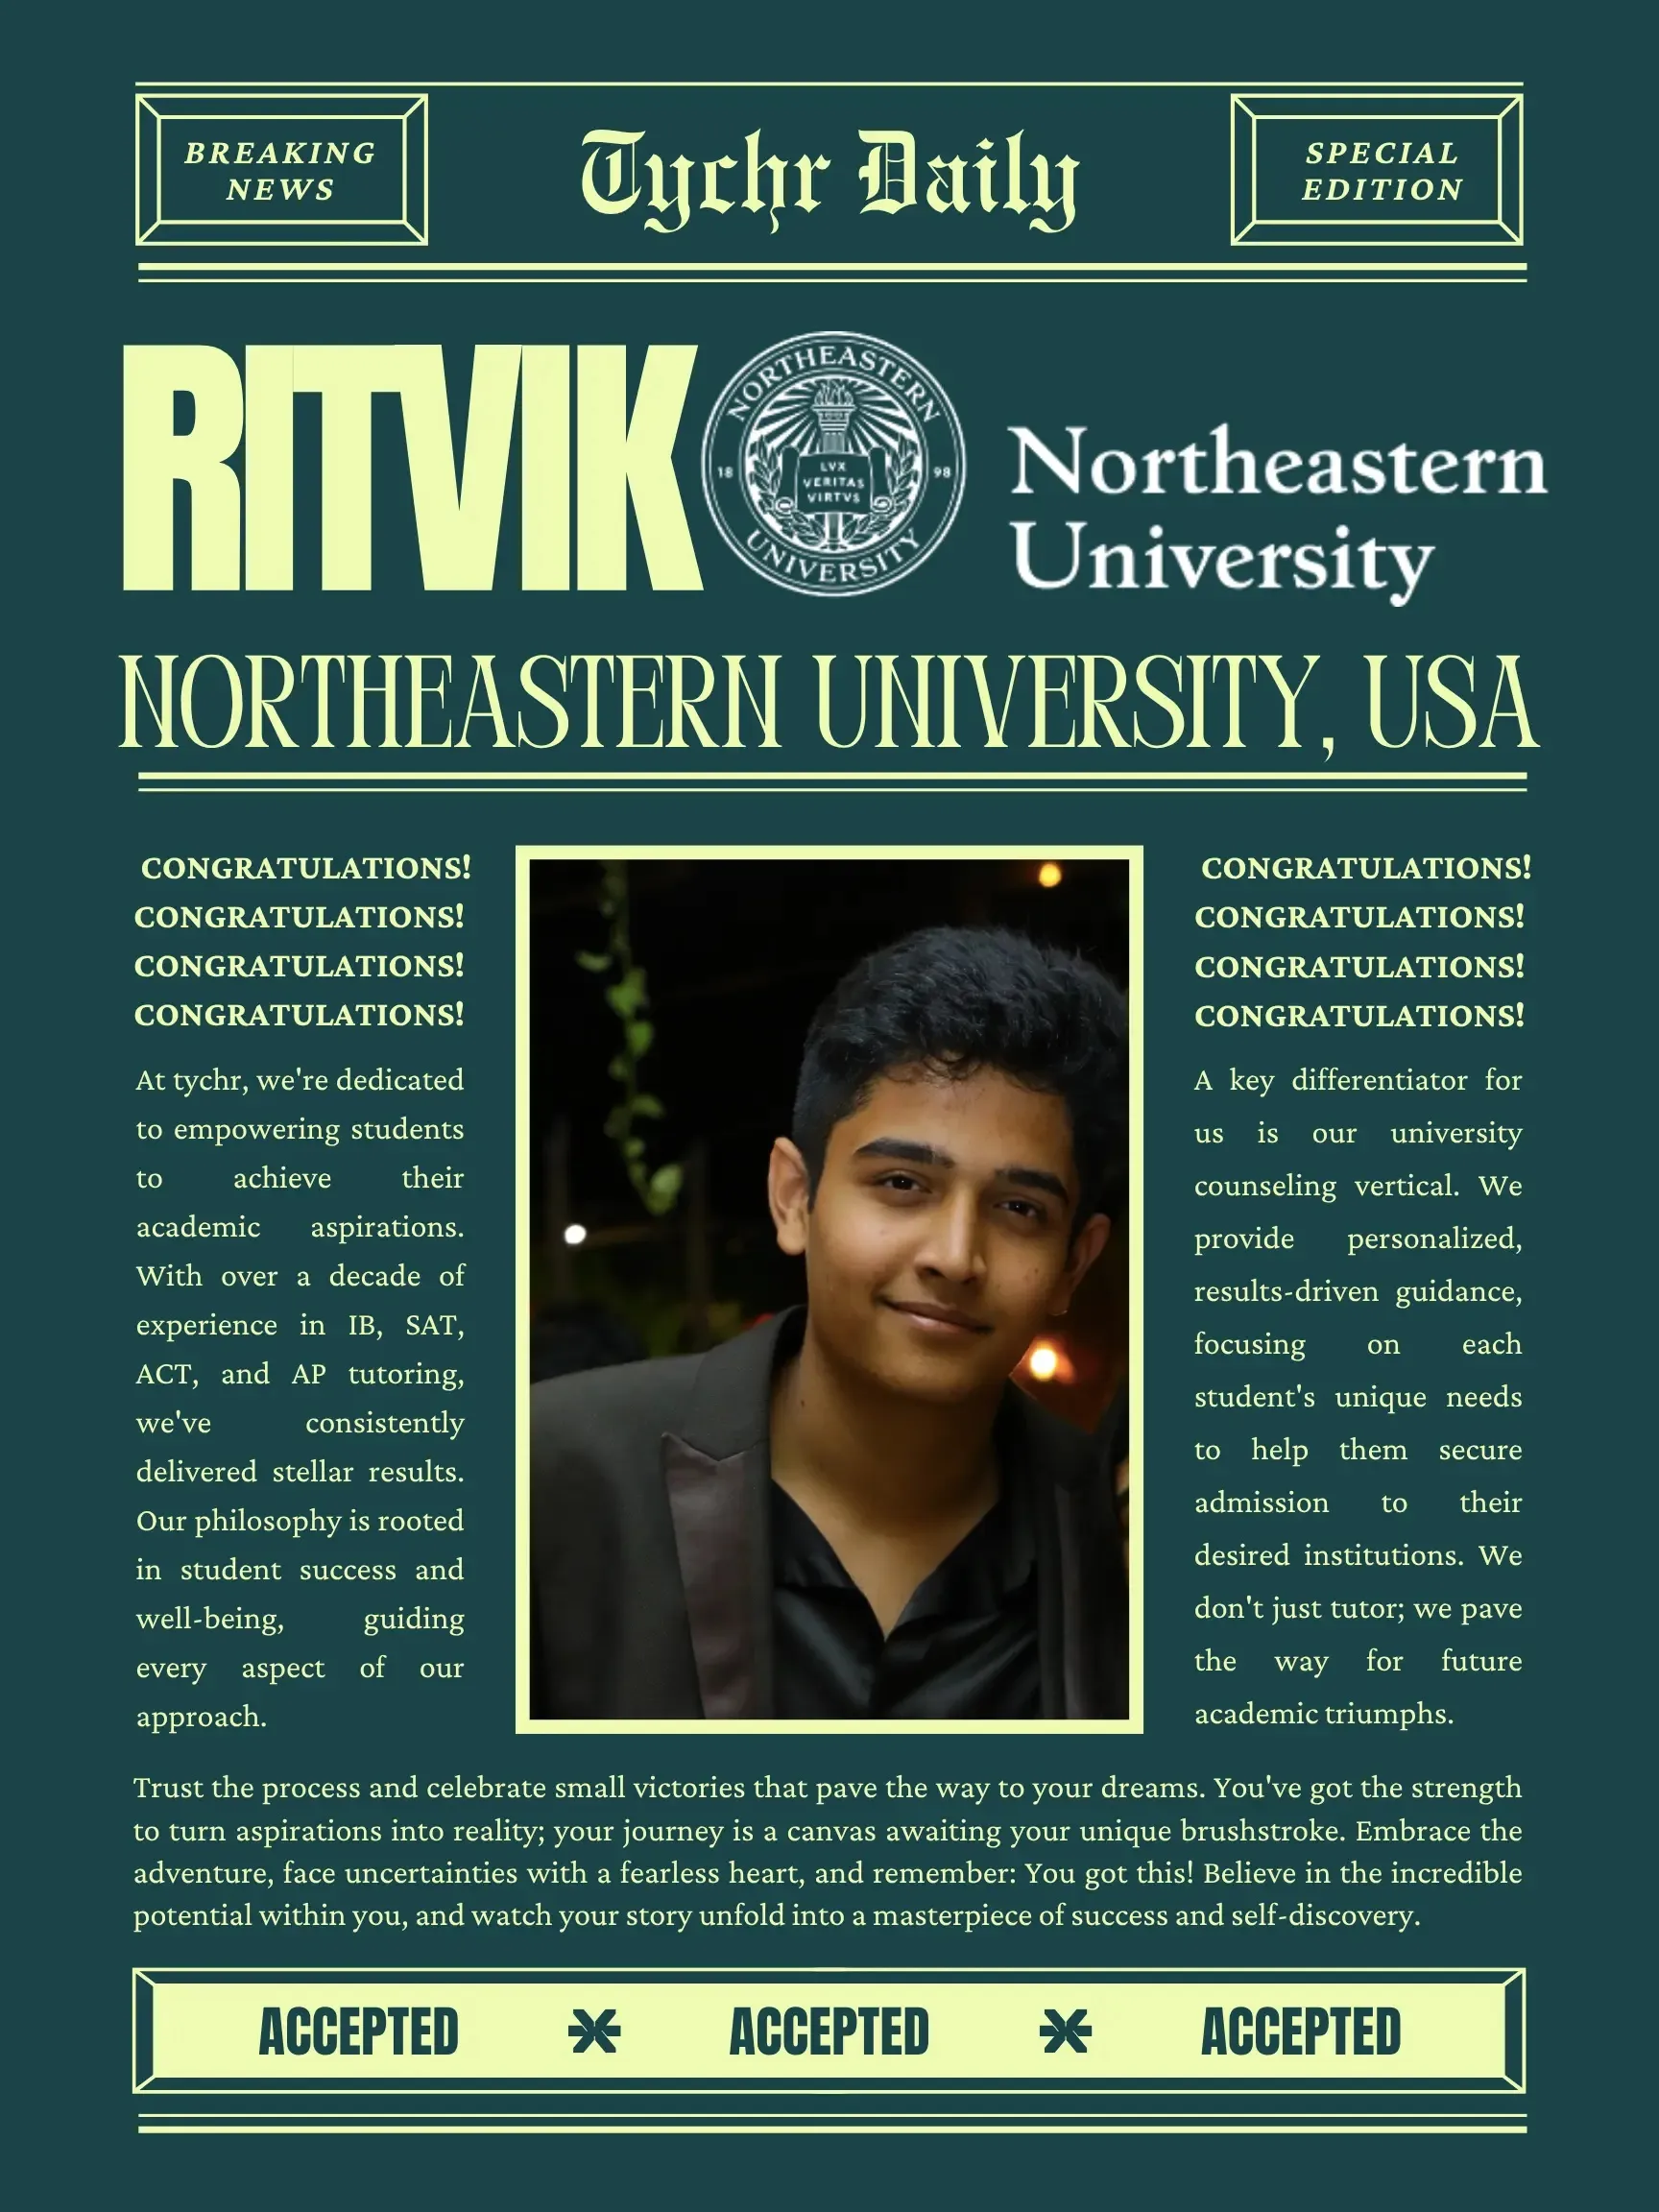

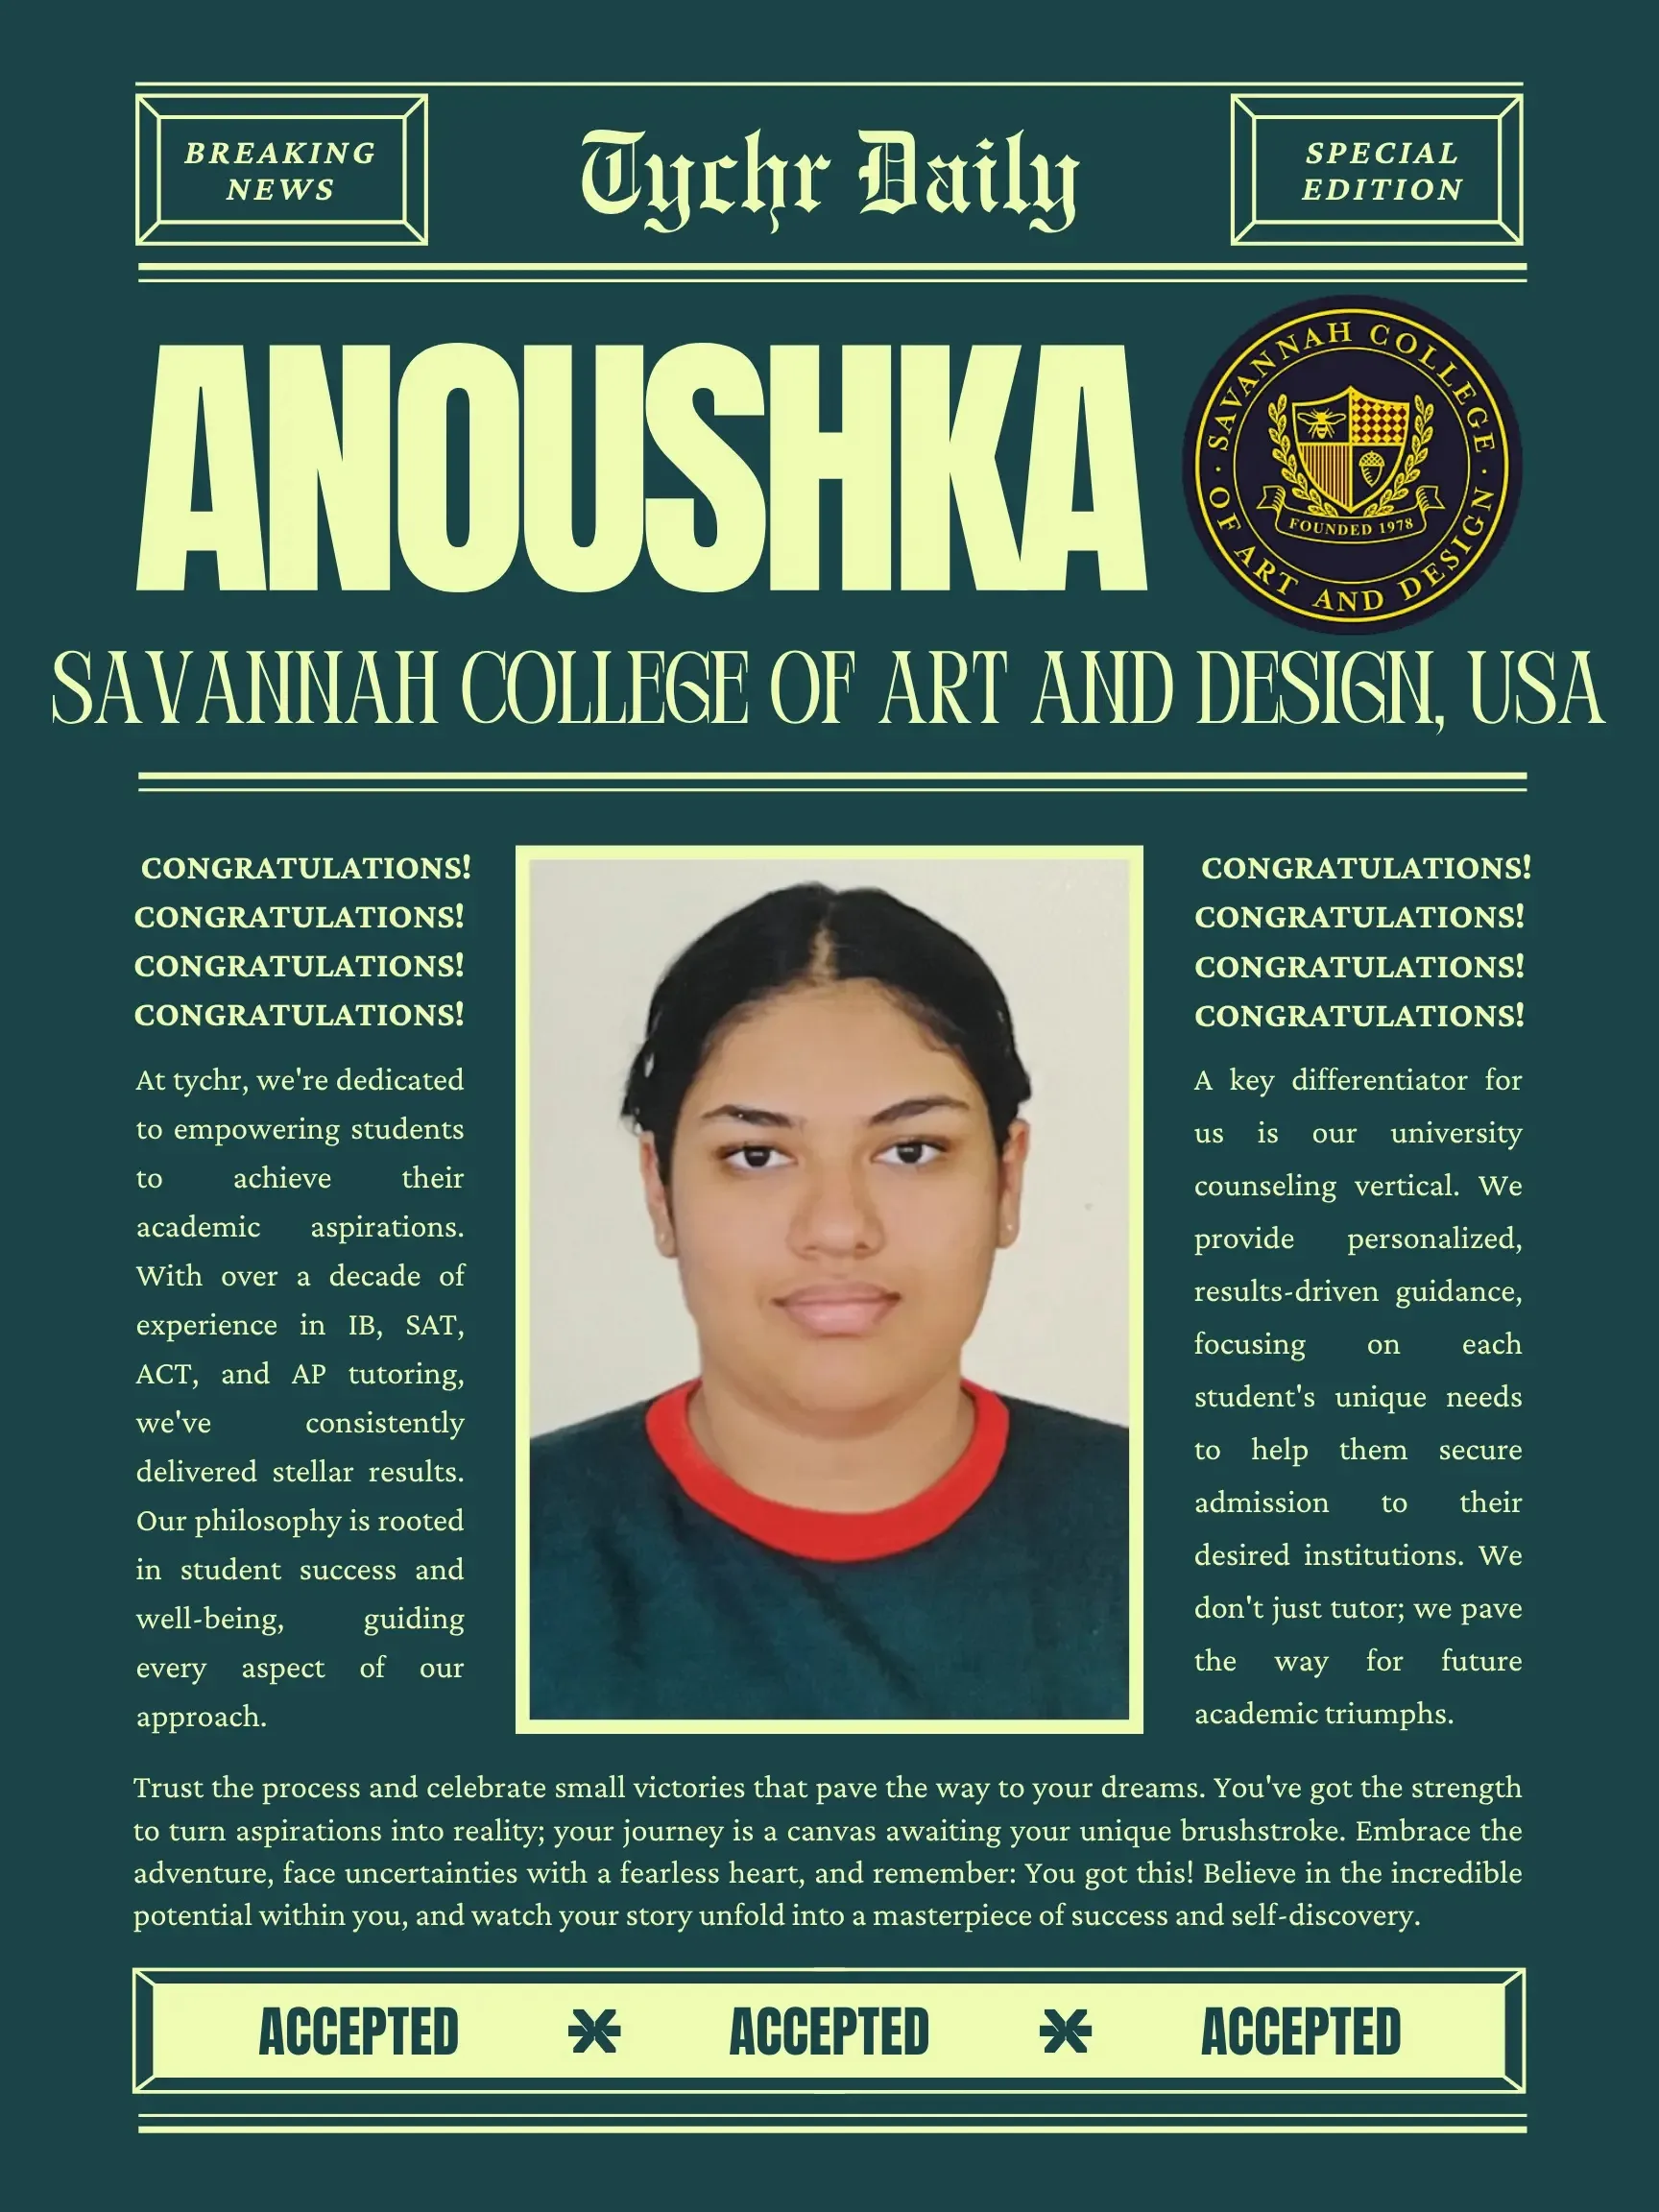
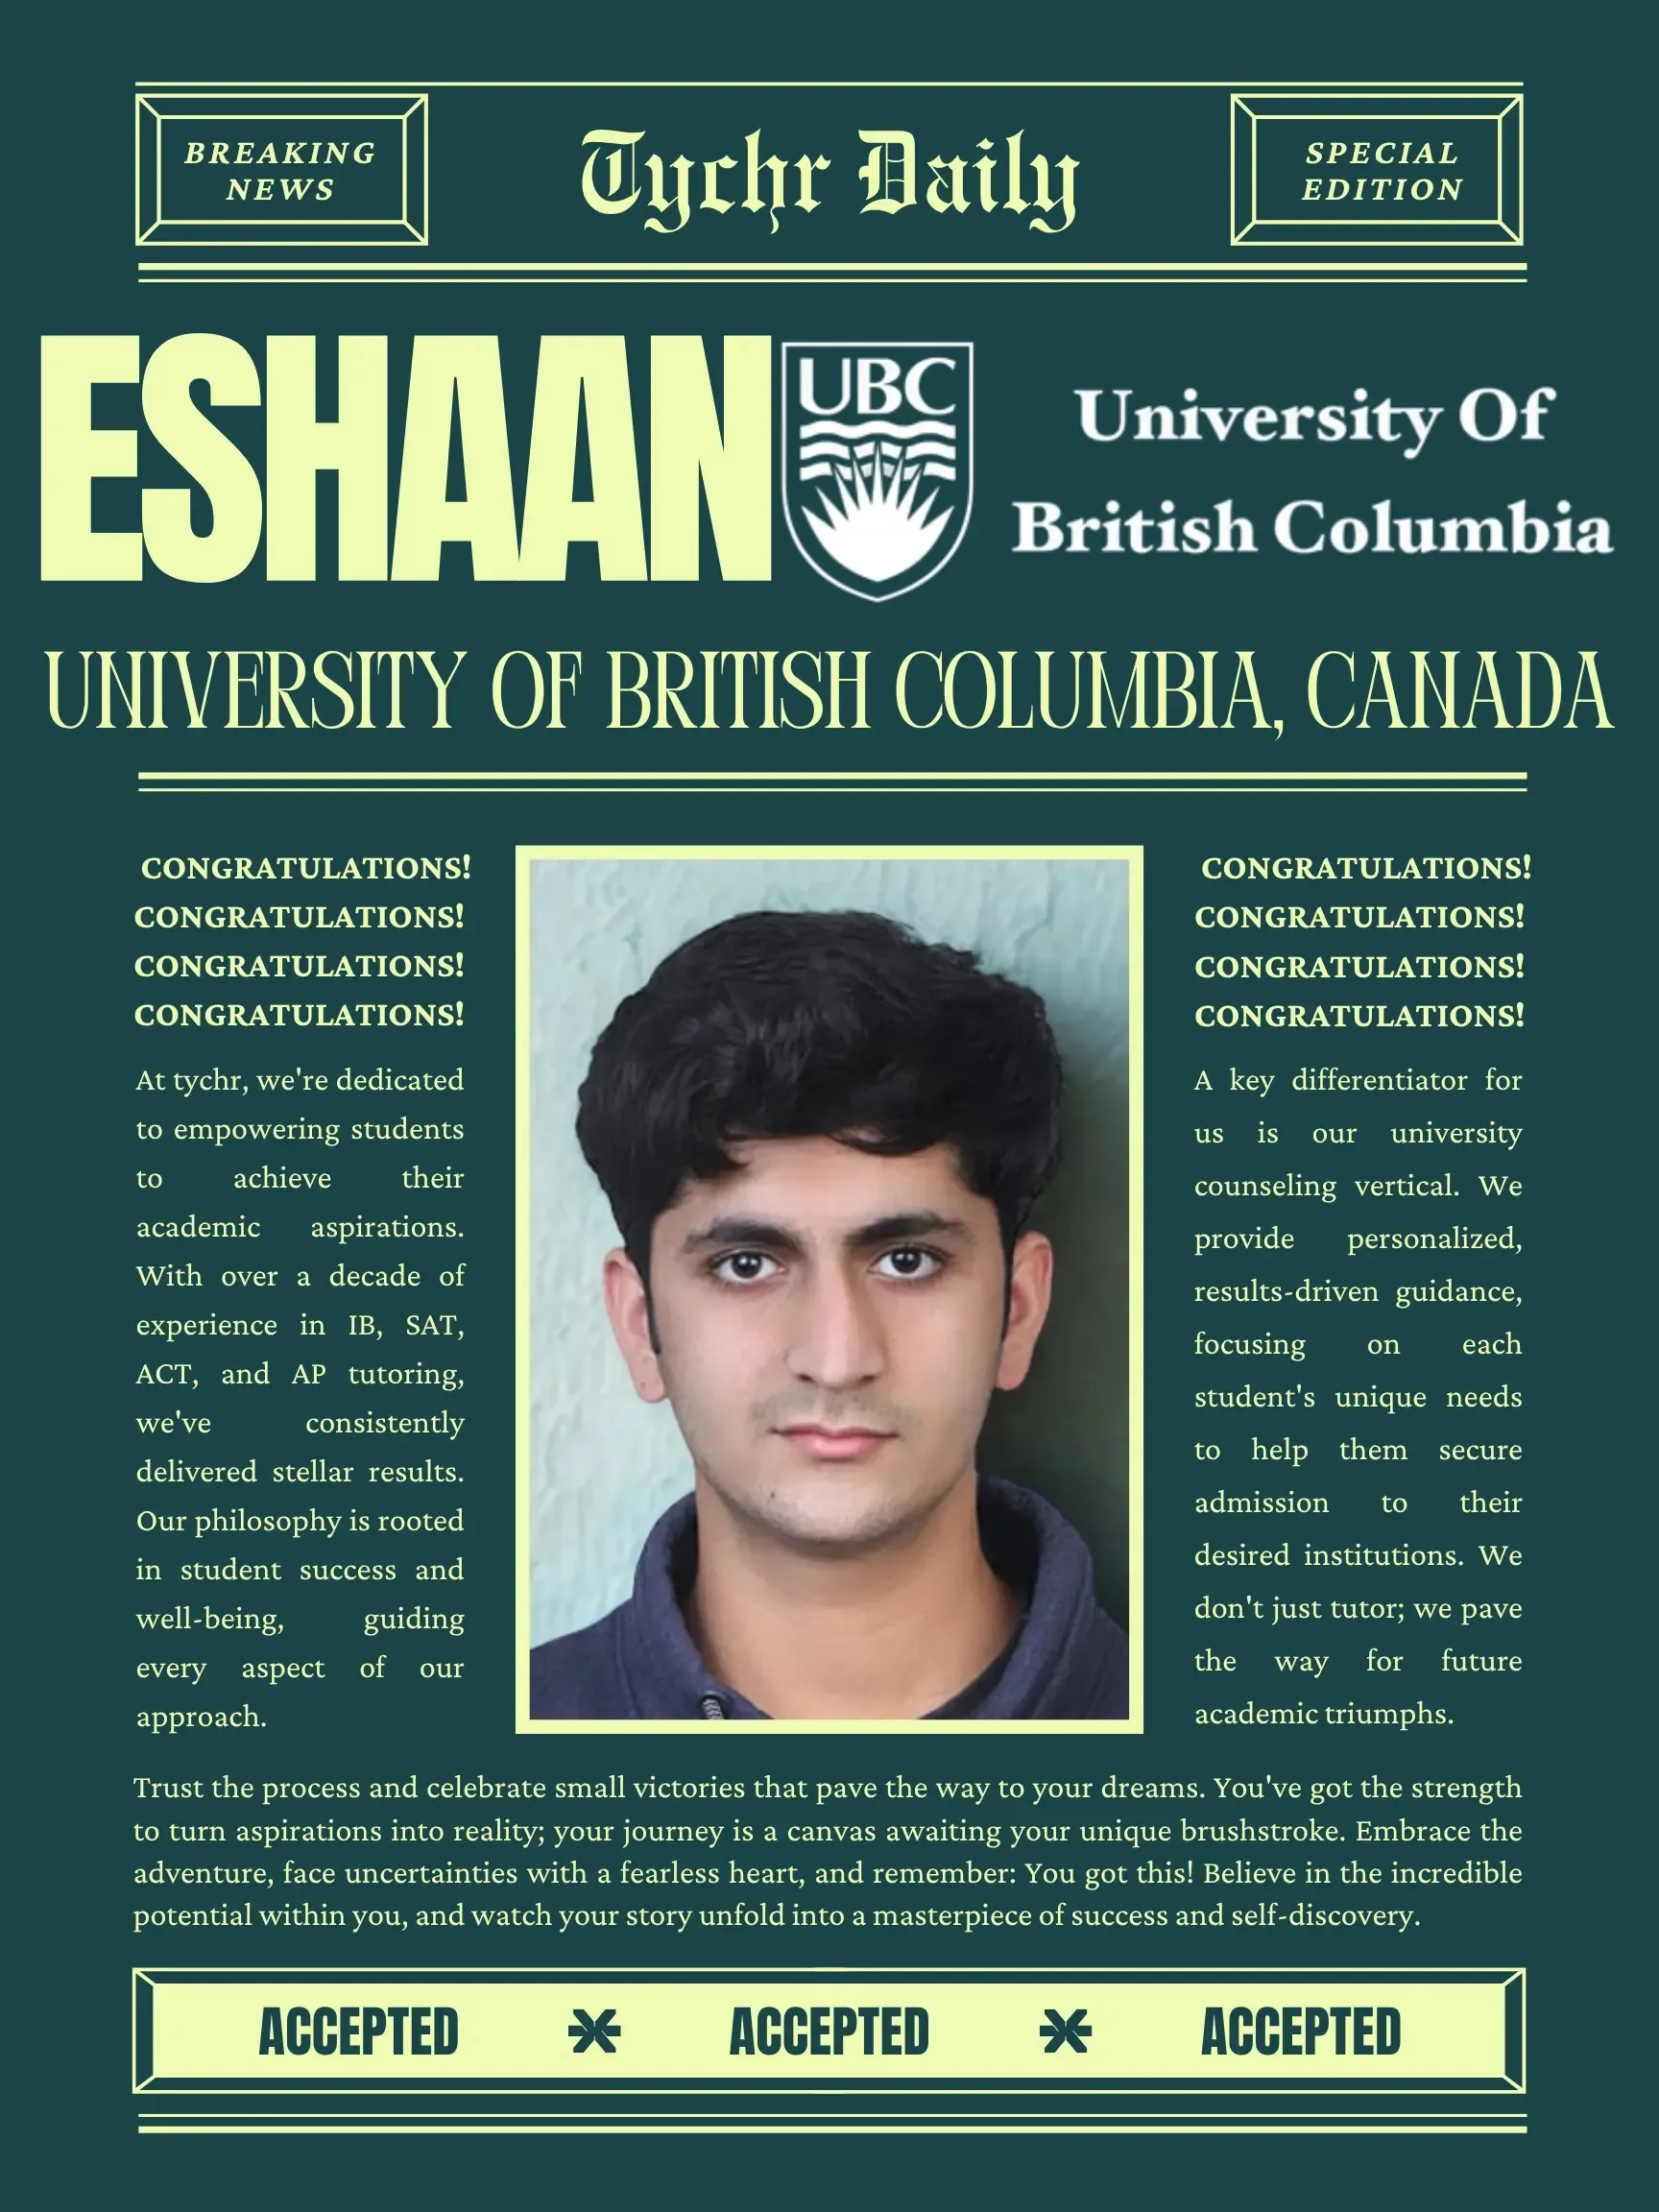
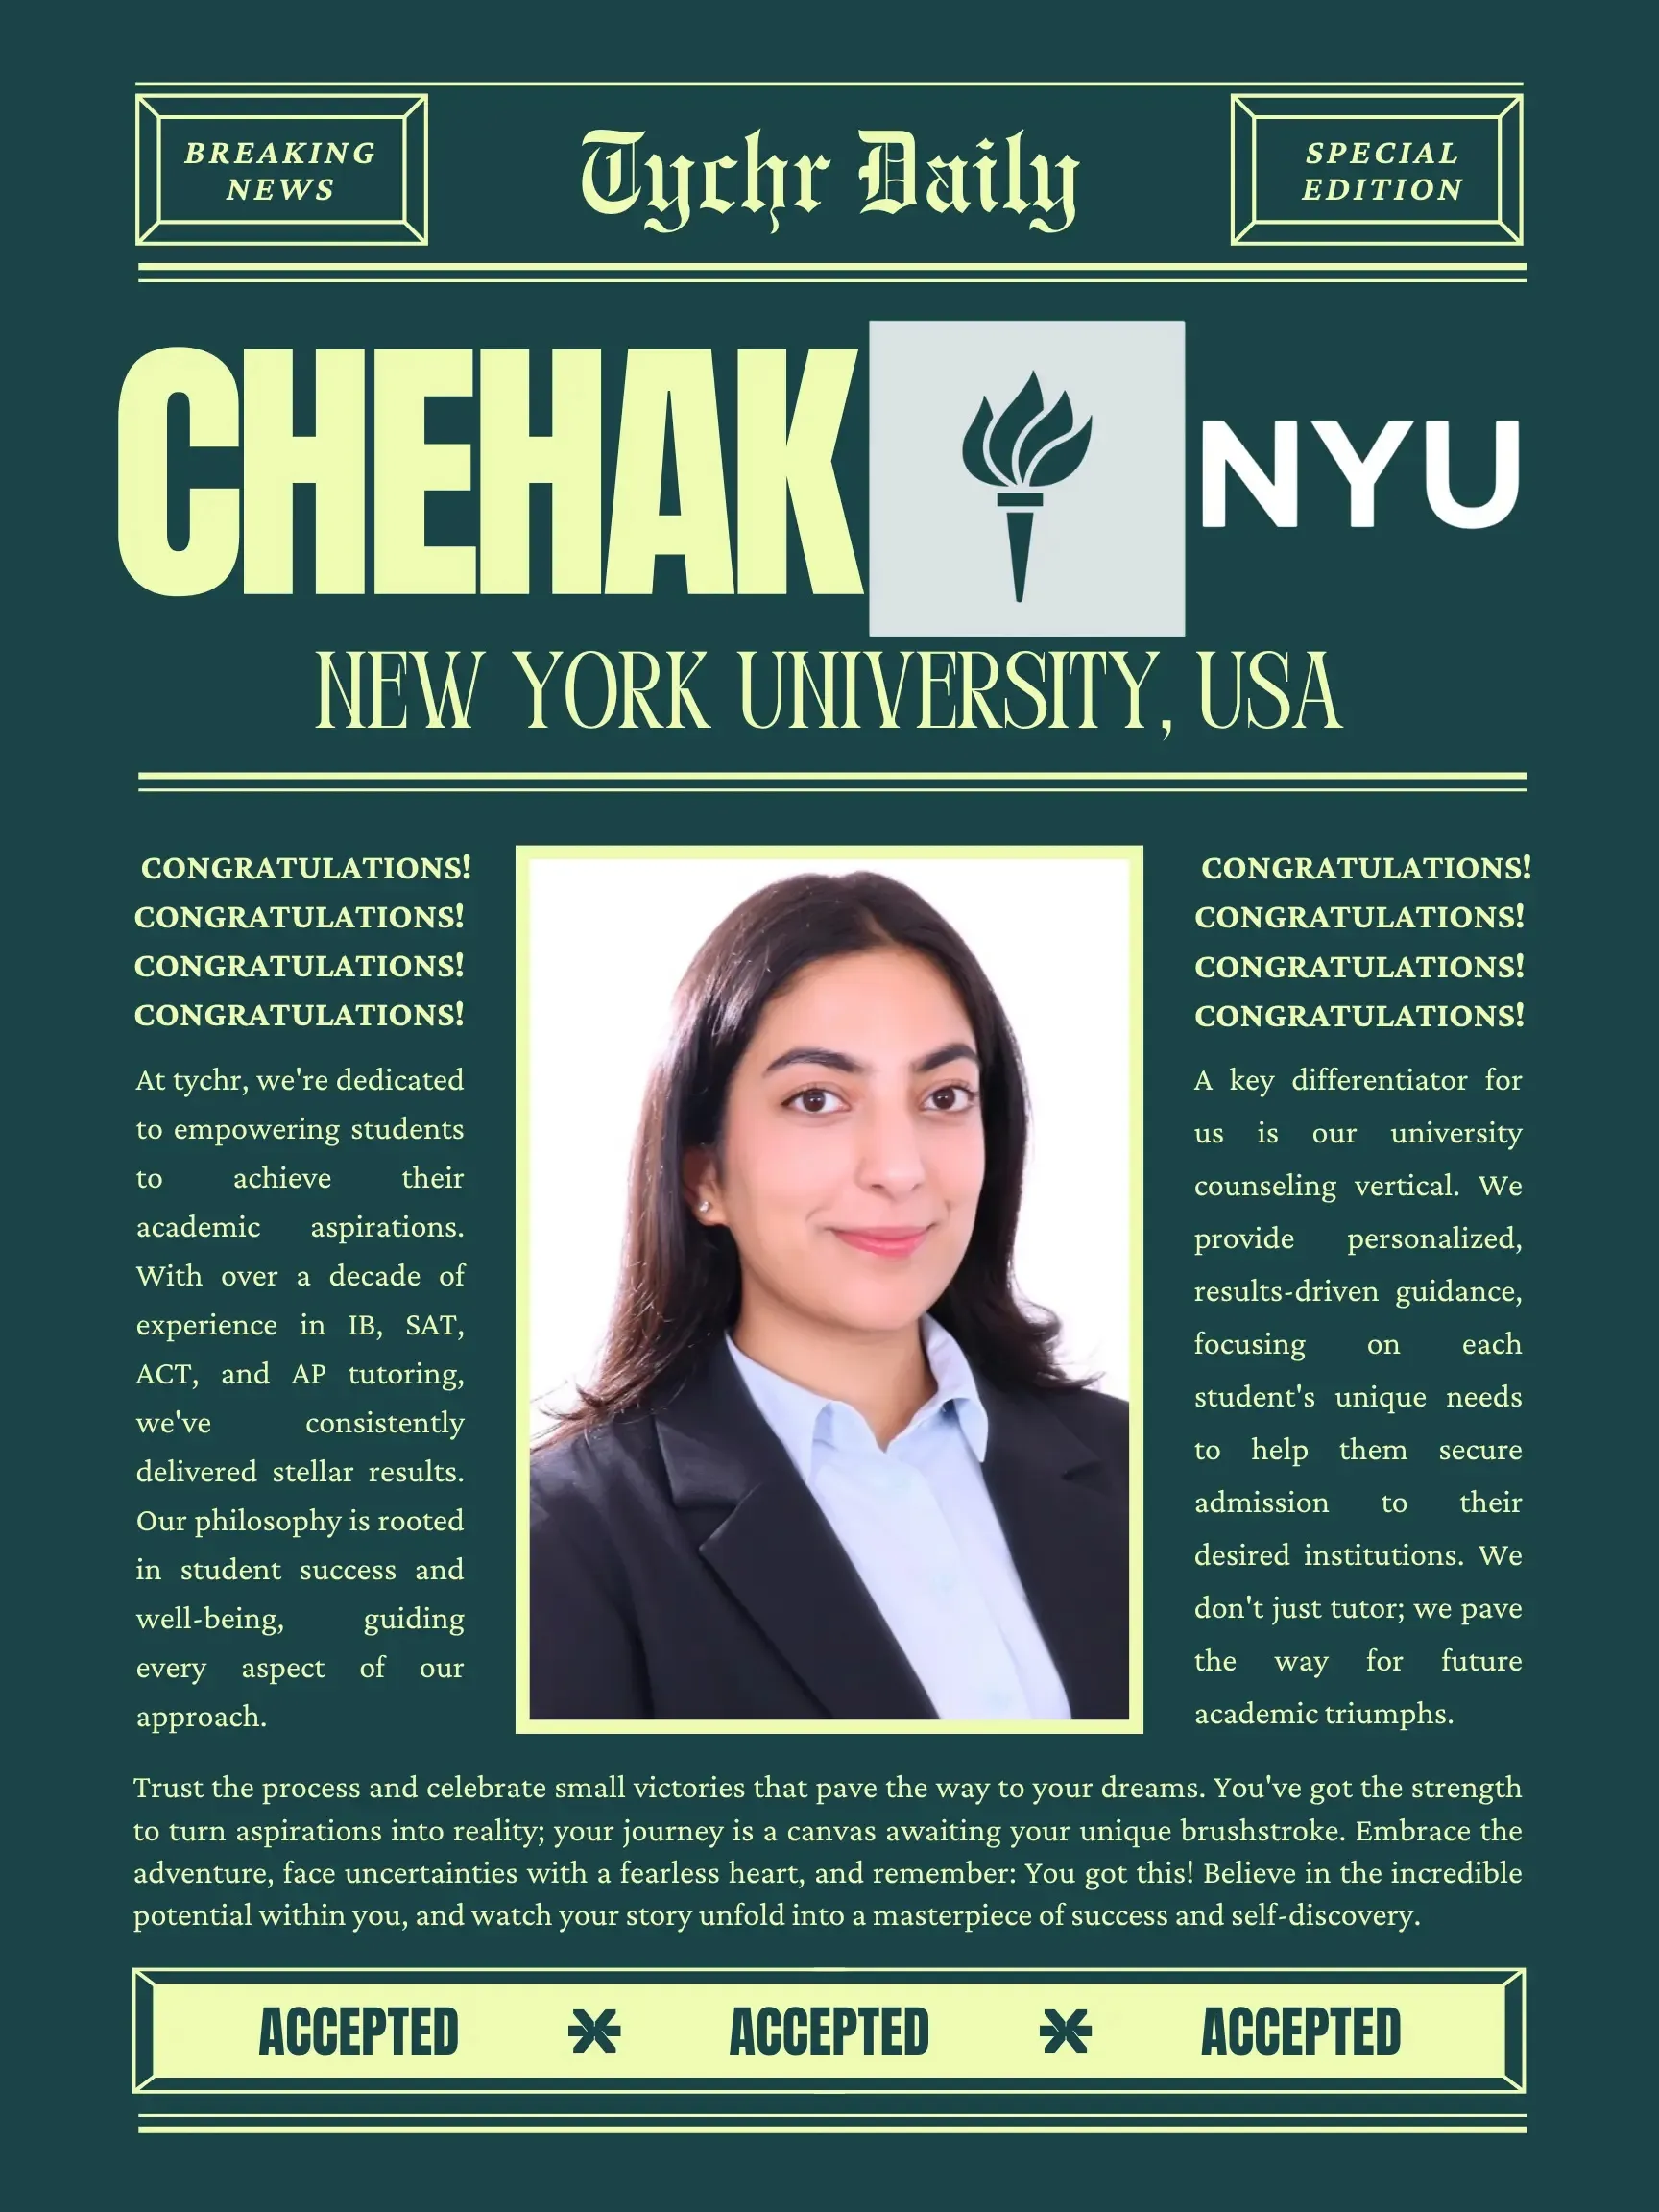

Start your journey with the right guidance.
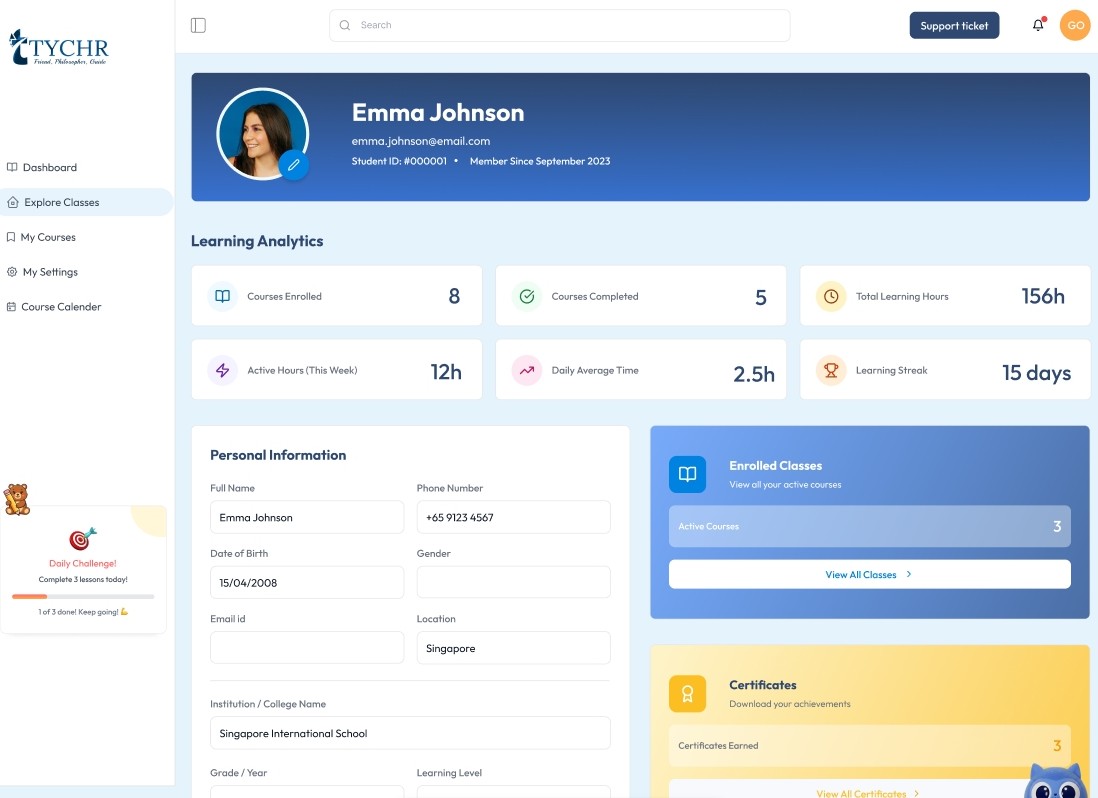
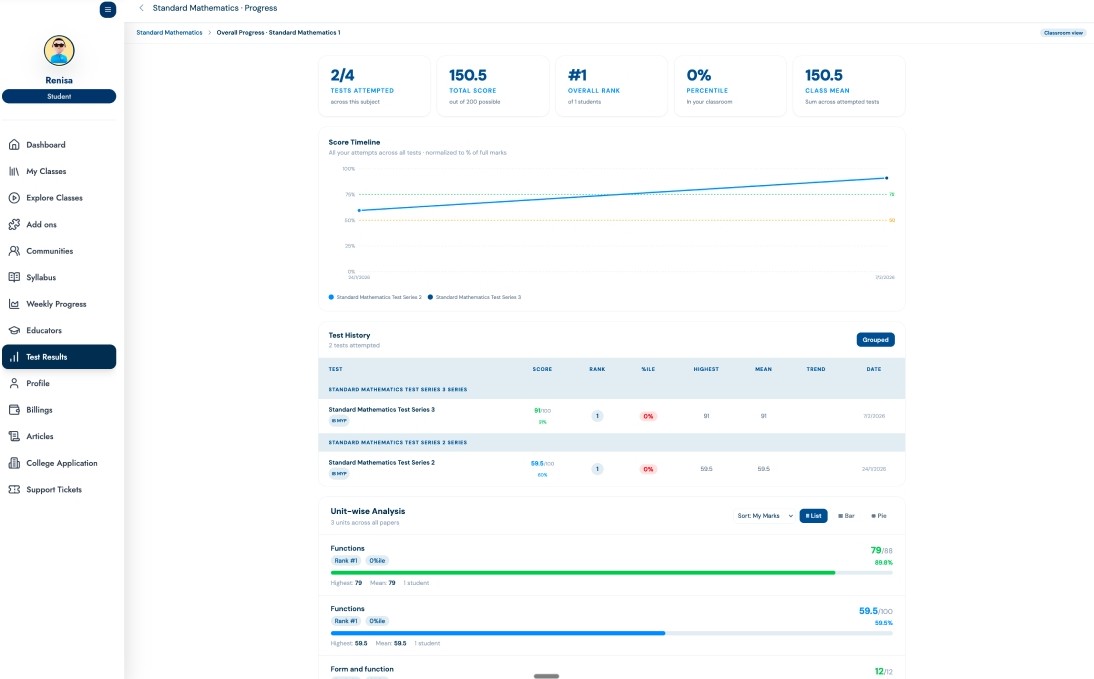
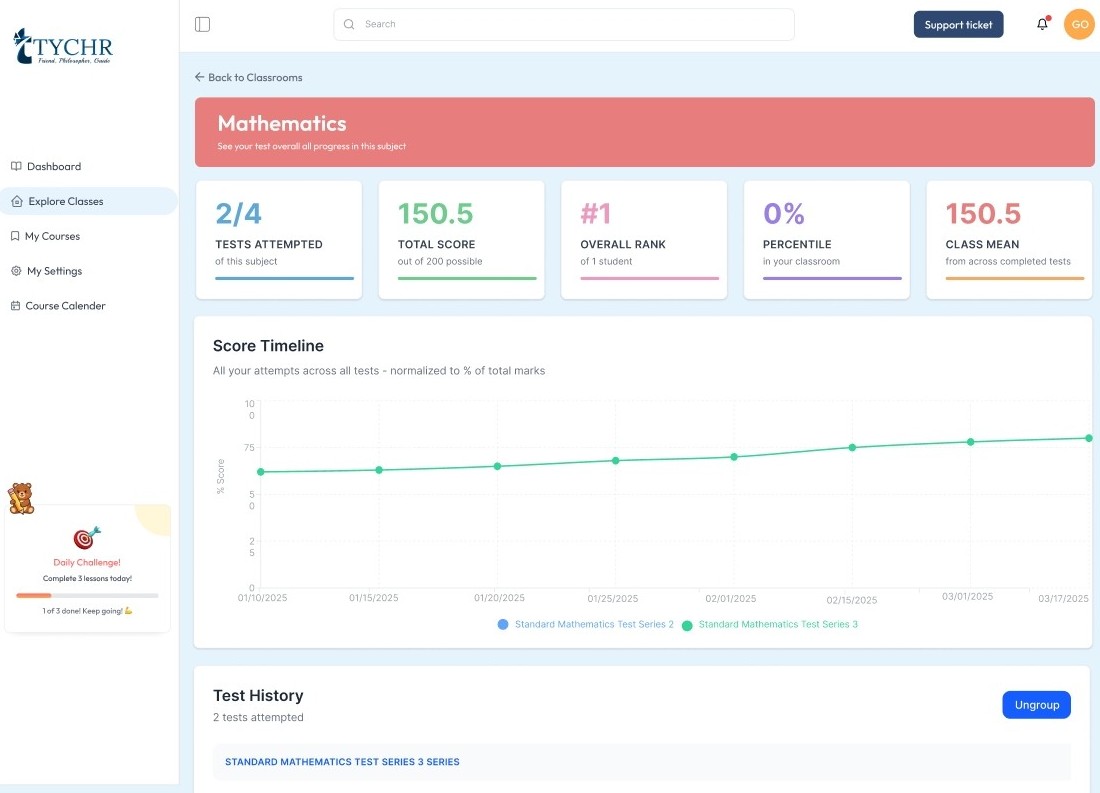
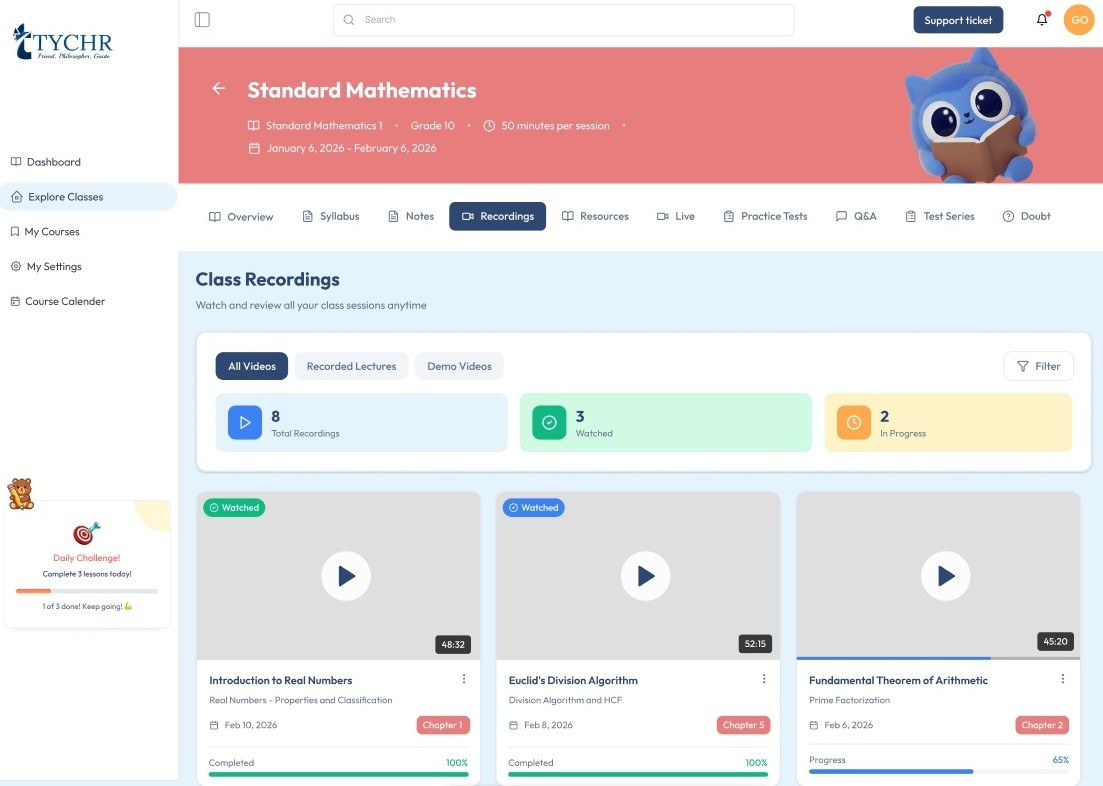
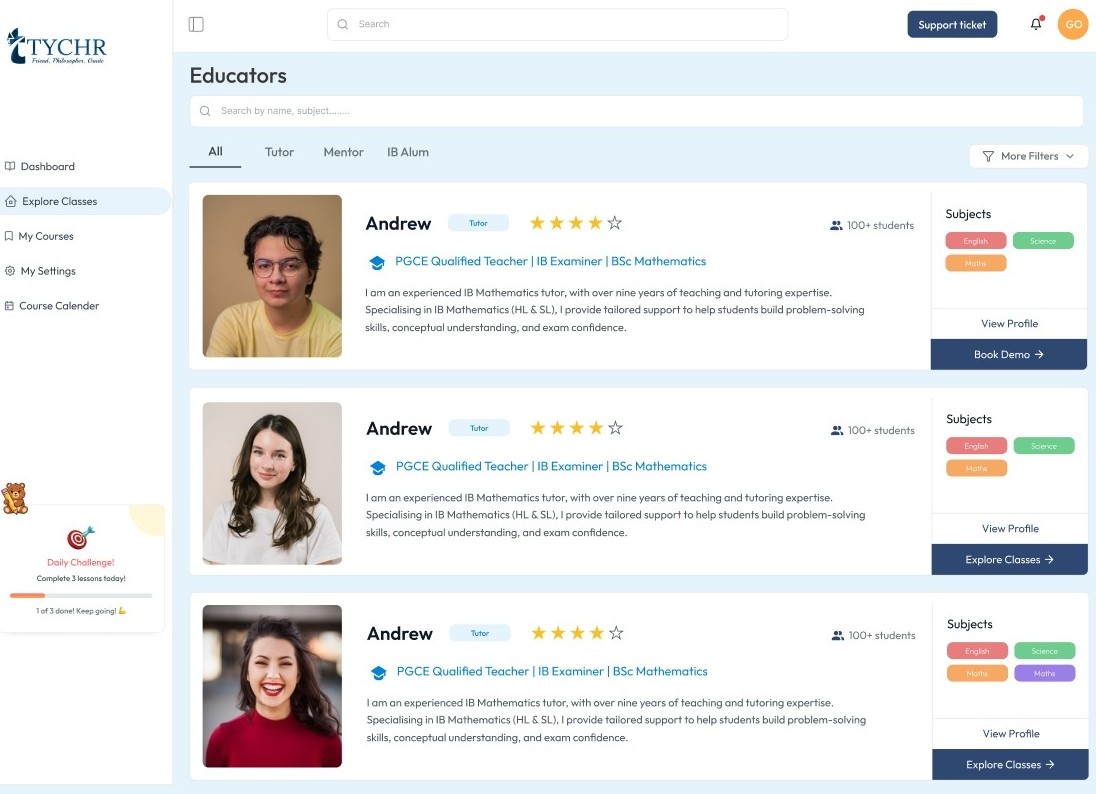
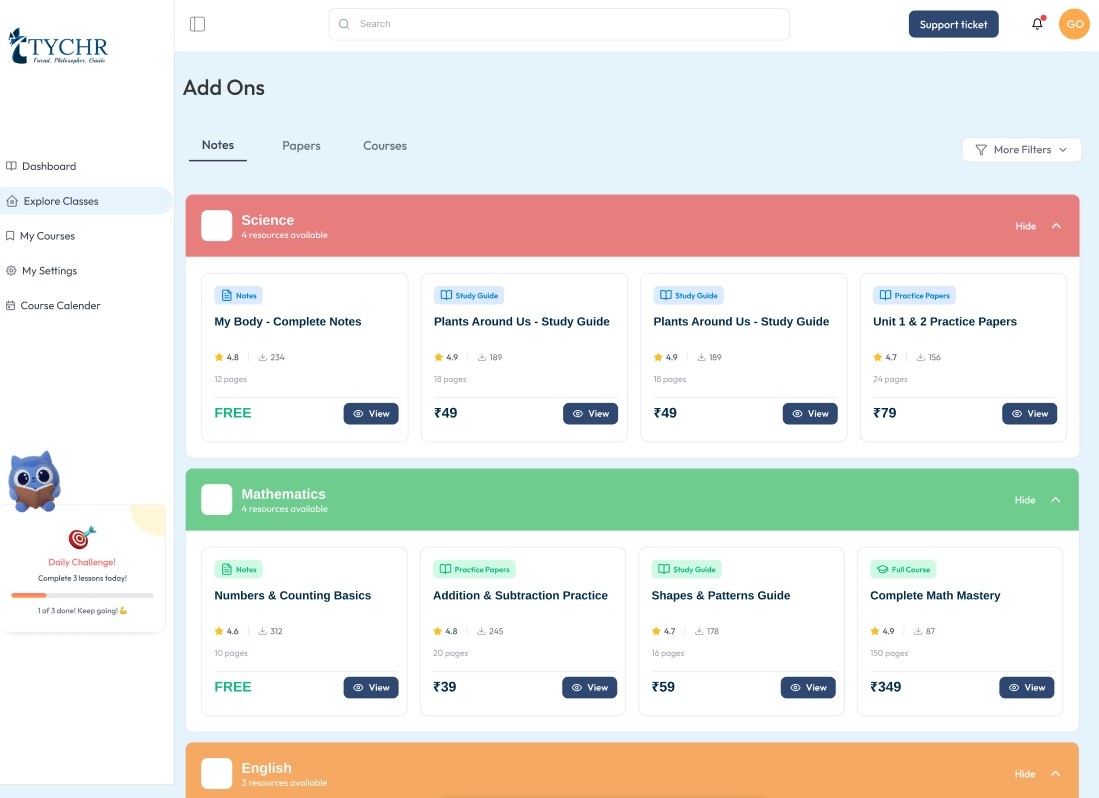
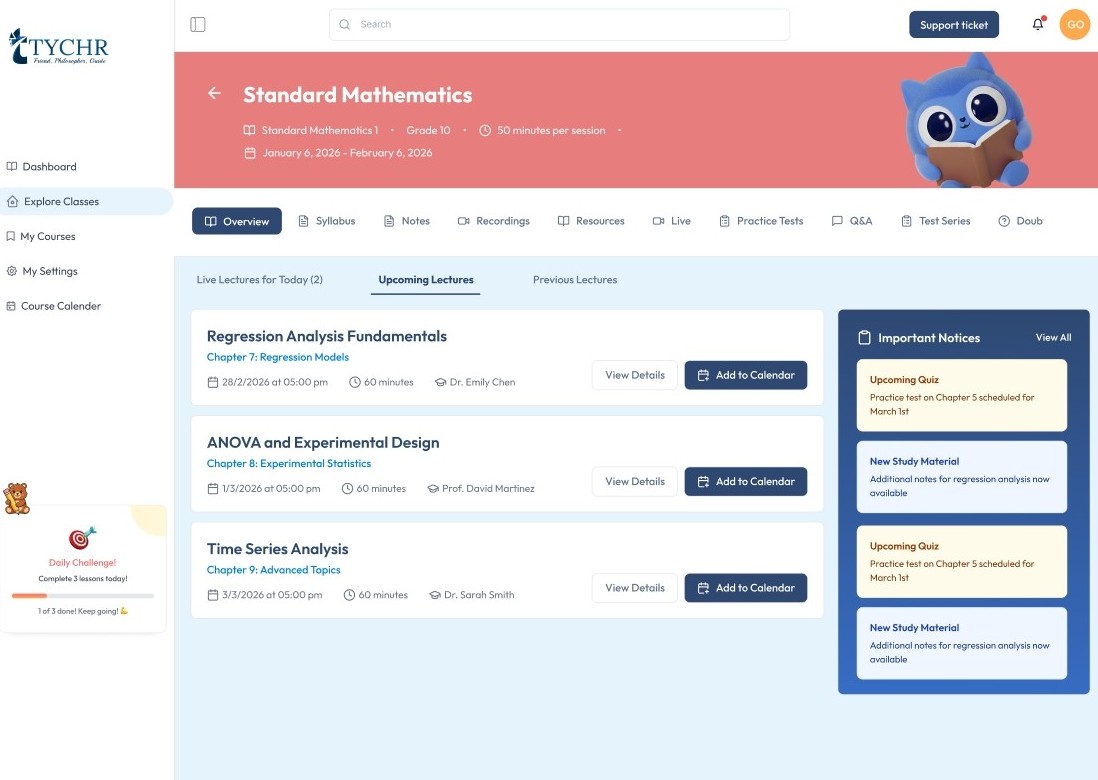
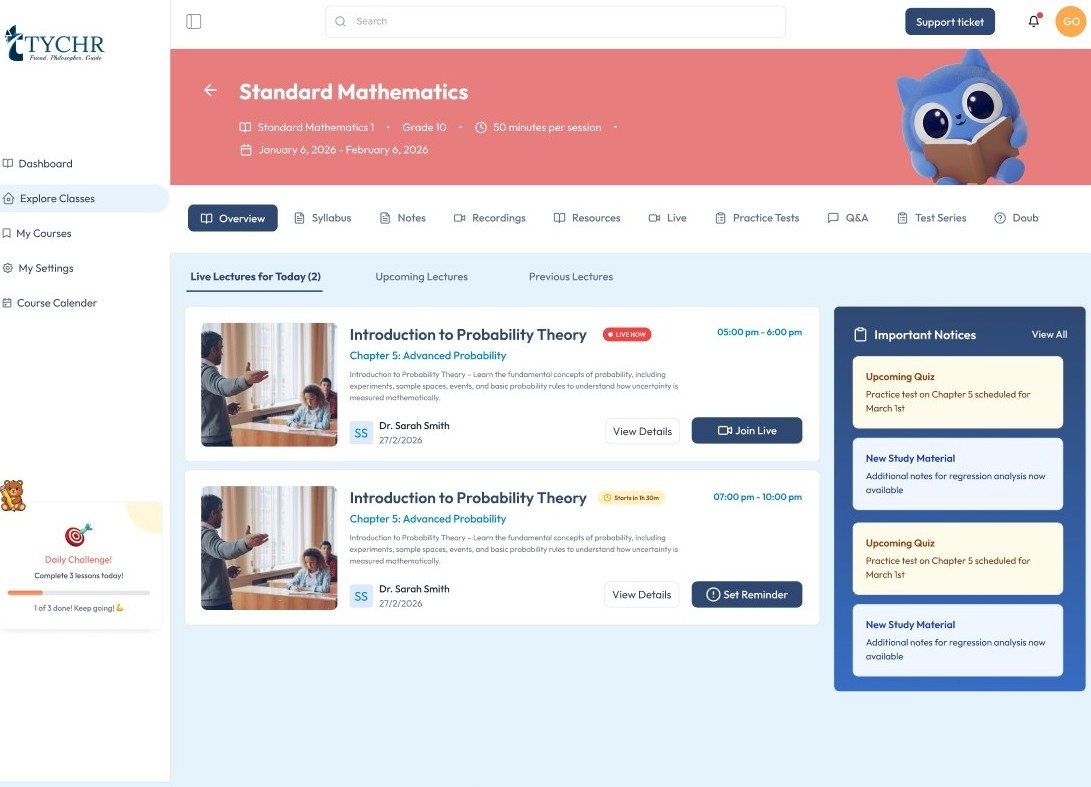
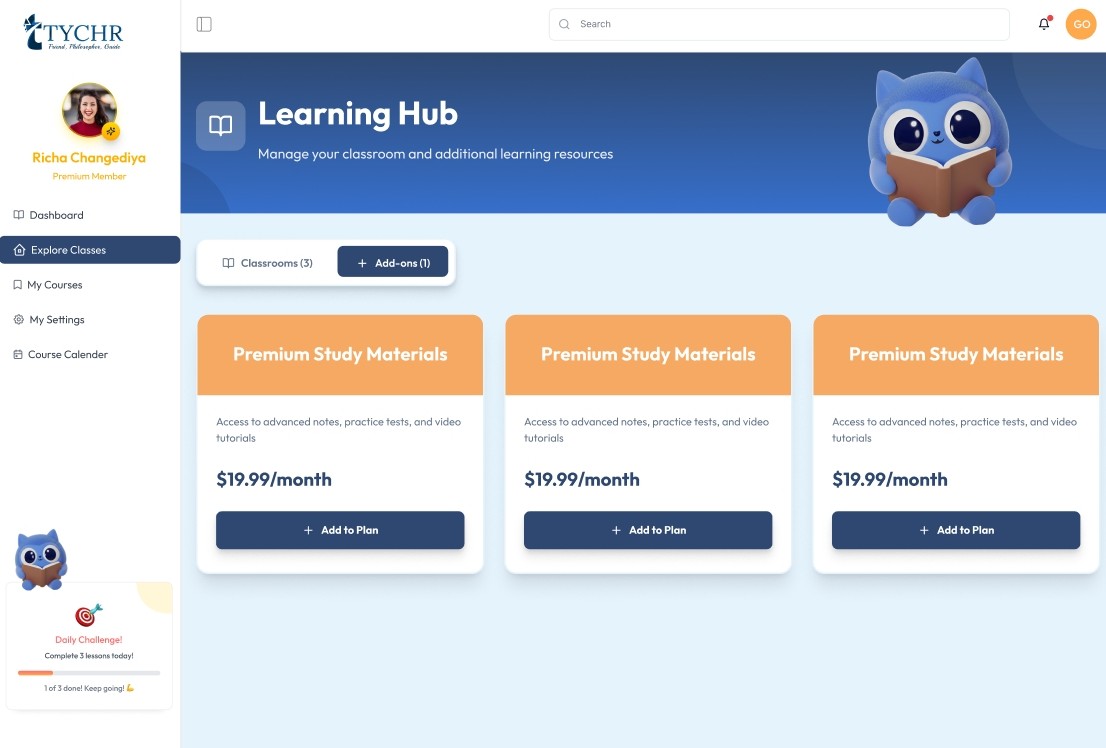
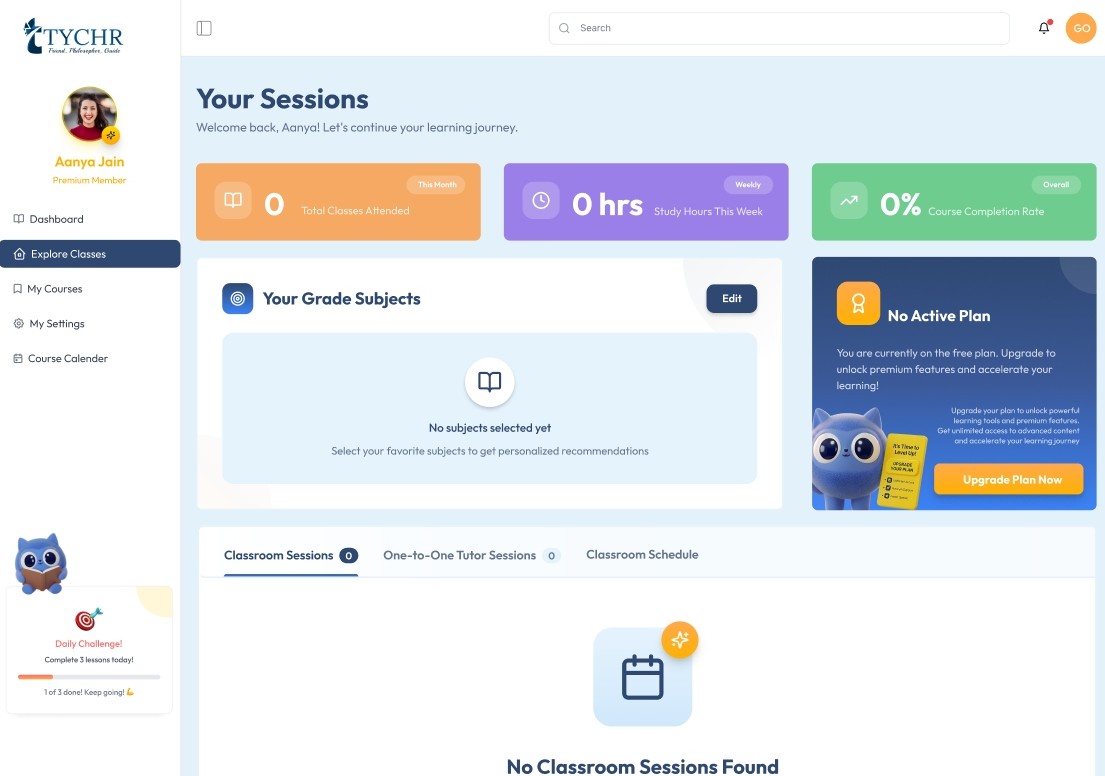
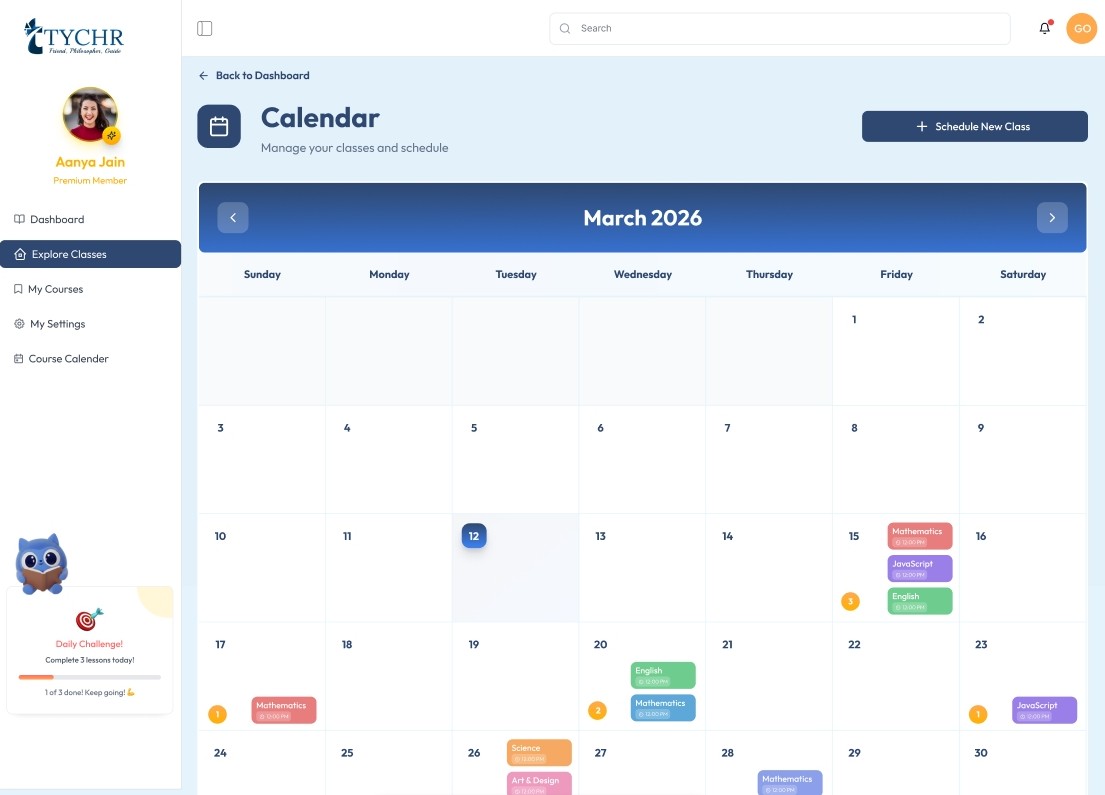
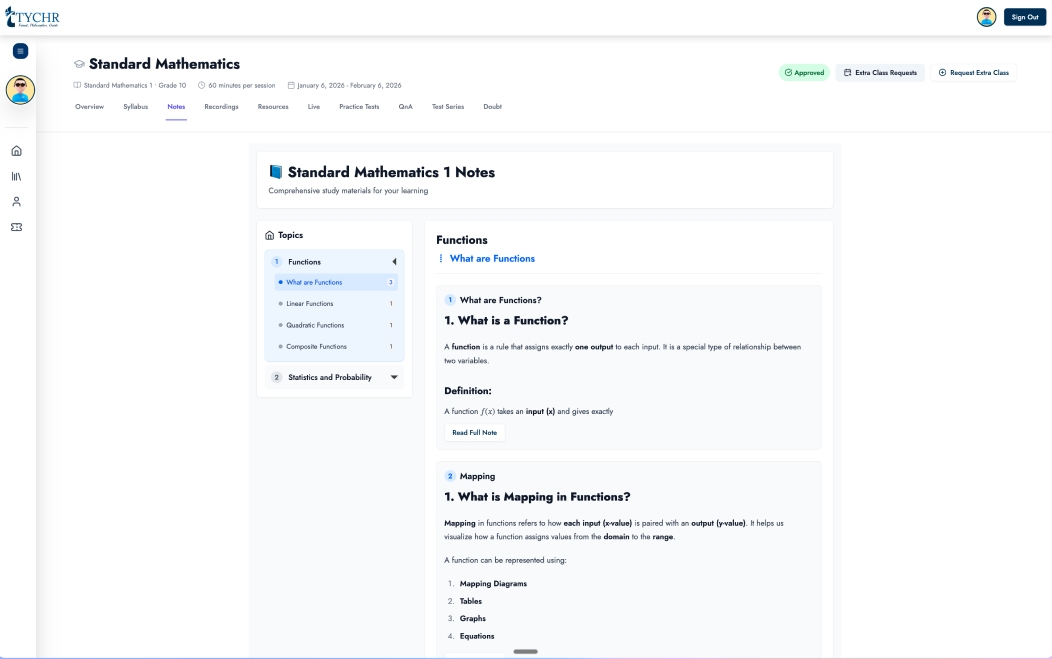
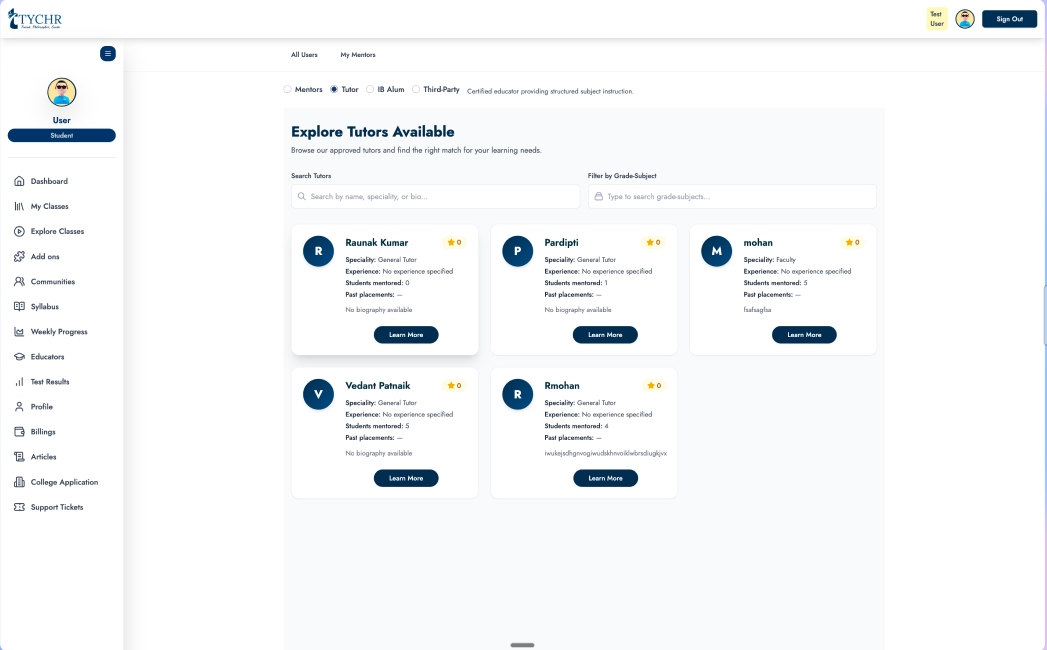
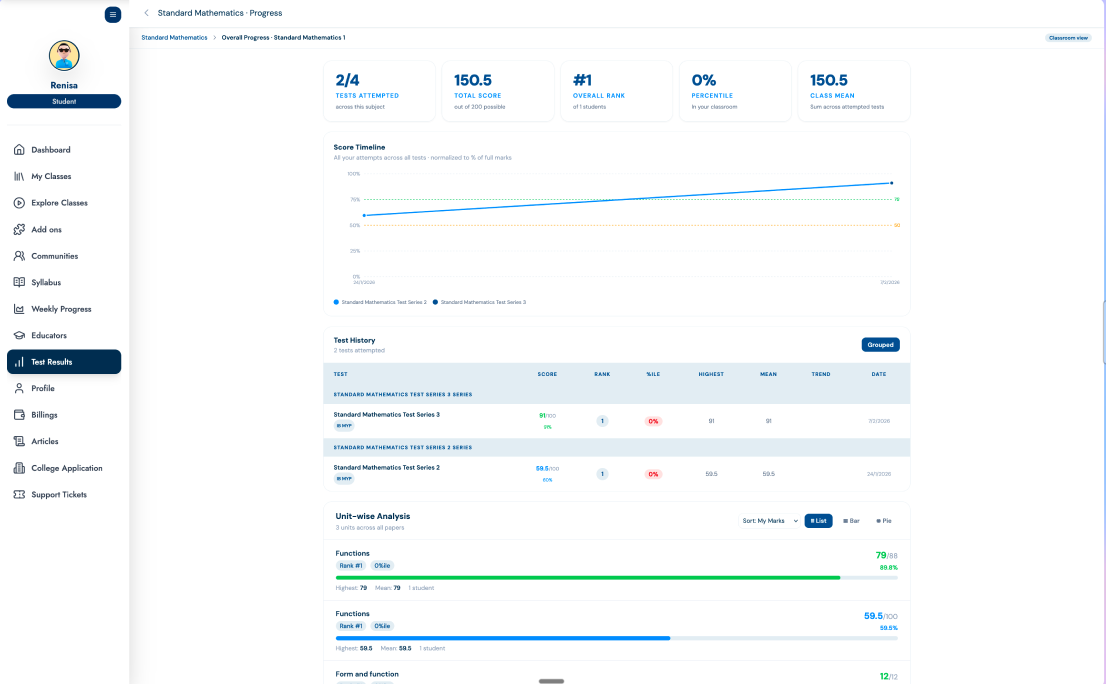
Explore our learning system
A platform designed around how students actually learn — adaptive, intuitive, and always one step ahead.
5000+
Students enrolled
100+
Expert tutors
95%
Satisfaction rate
70+
Countries reached
What Is AP Statistics?

Course Length
Full academic year
September – May
Exam Date
Early May
Annually
Exam Duration
3 Hours
Total exam time
Exam Structure
Two Sections, Equal Weight
Section I
40 Multiple Choice Questions
90 min · 50% of score
Section II
6 Free Response Questions
90 min · 50% of score
Multiple Choice (MCQ)
40 questions in 90 minutes, worth 50% of the total score. Tests all four big ideas across both conceptual understanding and context application. Note that no formula sheet is provided during this fast-paced section.
Free Response (FRQ)
6 questions in 90 minutes, worth 50% of the total score. Questions 1–5 are shorter context problems, while Question 6 is a rigorous 'investigative task' requiring extended statistical reasoning. This section is where the highest scores are won or lost.
Tools & Formula Sheets
An official formula/table sheet and advanced graphing calculator are fully permitted on the FRQ section. Mastering your calculator workflow for complex significance tests, confidence intervals, and linear regressions is vital.
AP Statistics Syllabus
Unit-by-Unit Breakdown
Exploring One-Variable Data
- Graphical displays
- Summary statistics
- Comparing distributions
Exploring Two-Variable Data
- Scatterplots
- Correlation
- Linear regression
Collecting Data
- Census vs. sample
- Experiments
- Observational studies
Probability, Random Variables & Distributions
- Probability rules
- Discrete variables
- Binomial & geometric models
Sampling Distributions
- Central Limit Theorem
- Mean & proportion sampling
- Core conditions & requirements
Inference for Categorical Data: Proportions
- Confidence intervals
- Significance tests
- Two proportions evaluation
Inference for Quantitative Data: Means
- t-procedures
- Paired data metrics
- Two-sample tests
Inference for Categorical Data: Chi-Square
- Chi-square GOF (Goodness-of-Fit)
- Chi-square independence mapping
Inference for Quantitative Data: Slopes
- Slope inference matrices
- Linear models
- Transformations
Exploring Data (Units 1–2)
Descriptive Statistics & Graphical Analysis
The SOCS Framework
We actively drill the SOCS description framework (Shape, Outliers, Center, Spread) so students can describe any single-variable distribution quickly, completely, and contextually to capture full marks.
Bivariate Strategy
For two-variable data, we zero in on the precise distinction between correlation and causation, alongside interpreting computer regression outputs—the exact zones where partial credit on FRQs is most frequently dropped.
Graphical Displays
Summary Statistics
Distributions

Study Design (Unit 3)
Coaching for Flawless Data Collection Methods

Random Sampling
SRS, stratified, cluster, and systematic methods. We teach students how to identify execution bias and describe sampling steps flawlessly.
Experimental Design
Randomization, replication, direct control, and blocking. Mastering how to block to reduce variance is a frequent FRQ differentiator.
Observational Studies
Tracking variables without assigning treatments. We emphasize identifying confounding variables and why correlation does not equal causation.
Random Assignment
Control Groups
Blinding Methods
Replication
Mastering the Core Distinctions
The conceptual gaps between an experiment vs. observational study, and randomization vs. random selection dictate your scope of inference. These subtle nuances are heavily targeted in both MCQ and FRQ sections. We drill students using scenario-based practice profiles until they can confidently classify, isolate errors, and justify any custom study design framework in under 60 seconds.
Probability & Random Variables
Concepts & Practice
Probability Rules
Random Variables
Special Distributions

Master Probability for FRQs
Probability questions appear in both multiple choice and free response. Our tutors focus on showing your work clearly and using correct notation.
Statistical Inference
Confidence Intervals & Hypothesis Tests
Confidence Intervals
Hypothesis Tests

One Proportion z-test
Single categorical variable
Two Proportion z-test
Compare two groups
One Sample t-test
Single quantitative variable
Two Sample t-test
Compare two means
Paired t-test
Before/after or matched pairs
Chi-square tests
GOF or independence
AP Statistics Free Response Questions
FRQ Strategies for Maximizing Rubric Points
6 Questions in 90 Minutes (50% of Score)
FRQs are where the exam is won or lost. Precise vocabulary is mandatory.
Rubric Maximization Rules
State the Procedure Explicitly
Name the exact inference procedure at the start of every inference question (e.g., 'I will conduct a two-sample t-test for the difference in population means'). College Board readers search for this string explicitly. Omitting it costs full rubric points even if all math is flawless.
Check Conditions in Full Sentences
Random, Normal/Large Counts, and Independence must be checked with written justification—never just a checklist. Show how each constraint is satisfied using explicit facts from the problem statement to secure full credit.
Expose All Calculation Steps
Write the general formula, show your exact value substitutions, and then compute. Correct formulas with standard substitutions qualify for partial credit if a minor arithmetic slip occurs. Raw calculator output alone scores a zero.
Conclude Stated completely in Context
Every hypothesis conclusion requires a clear P-value, a direct comparison to alpha, a formal decision (reject/fail to reject), and an explicit sentence linked to the problem's context. Generic phrasing will instantly drop structural points.
Master the Q6 Investigative Task
Question 6 is a 30-minute mini-investigation worth 25% of the total FRQ weight. We teach students to read all subsections first to uncover the conceptual narrative thread, then work systematically using first-principles statistical logic.
Why Precise FRQ Language Matters
College Board rubric criteria target weak vocabulary choices. Conceptually sound answers like 'the data shows that the medicine works' get graded zero. Trained answers require definitive phrasing: 'there is statistically significant evidence to conclude that the medication reduces blood pressure, on average, in the target population.' We explicitly drill these exact linguistic scripts until they become instinctual.
Writing "accept the null" instead of "fail to reject the null".
Calculator Skills for AP Statistics
TI-84 & Beyond
Essential TI-84 Functions
1-Var Stats
Mean, median, standard deviation
2-Var Stats
Correlation, regression equation
LinReg(a+bx)
Linear regression output
normalcdf
Normal probability calculations
invNorm
Find z-score for given probability
binompdf/cdf
Binomial probabilities
tcdf
t-distribution probabilities
χ²cdf
Chi-square probabilities
Show Your Work
Always write down calculator command and inputs used, even when using TI-84.
Practice Speed
Efficient calculator use saves 10+ minutes on the exam for checking work.
Other Calculators
TI-83, TI-Nspire, and Casio models also allowed. Know your model well.
AP Statistics Multiple Choice
Tips & Timed Practice
40 Questions • 90 Minutes
Average 2.25 minutes per question • Worth 50% of exam score
Read Carefully
Underline key words like 'NOT', 'ALWAYS', 'MOST LIKELY'
Eliminate Obviously Wrong
Cross out clearly incorrect options first
Work Backwards
Use answer choices to test scenarios
Check Units
Verify that answer makes sense in context
Manage Time
Don't spend more than 2 minutes per question
Skip & Return
Mark difficult questions and come back
Common Topics
- •Interpreting computer output
- •Identifying study design flaws
- •Probability calculations
- •Choosing correct inference test
- •Reading graphs and distributions
Practice Approach
Weeks 1-4
Untimed practice by unit
Weeks 5-8
Mixed untimed practice
Weeks 9-12
Full 40-question timed tests
Our tutors provide official College Board practice materials and teach time-tested strategies
One-to-One vs Group Tutoring
AP Statistics Sessions
One-to-One
- ✓Personalized pacing through all 9 units
- ✓Focus on your weak areas (probability, inference, etc.)
- ✓Flexible scheduling around your calendar
- ✓Individual FRQ review and feedback
- ✓Custom practice problem sets
Group Sessions
- ✓Learn with 3-4 students at similar level
- ✓Cost-effective exam preparation
- ✓Collaborative problem-solving
- ✓Structured curriculum coverage
- ✓Group practice test reviews
Tutor Profiles Subject Experts
Meet our highly qualified tutors with proven track records of student success.

Sreevidya KG
MSc in Chemistry with a Bachelor’s in Education, IB training, and Google certification.
20 Years
Experience
1500+
Students
5
Rating
Over 20 years of experience teaching Chemistry across IBDP, IGCSE, and AS/A Level curricula, including extensive international online tutoring.
Personalized IB tutoring with concept-focused learning approach.

Sandeep Nehra
IB Physics – Category 2 Certified | IBDP • IGCSE • AS/A Level • AP • AQA Physics
10+ Years
Experience
1200+
Students
4.9
Rating
An experienced IBDP and international Physics educator with over 10 years of multi-curriculum teaching experience across IBDP, IGCSE, AS/A Level, AP, and AQA.
Personalized IB tutoring with concept-focused learning approach.

Anjali Nayan Mistry
BA (Psychology), DELF B1 (French), B2.2 Alliance Française
11+ Years
Experience
1000+
Students
5
Rating
Have 11 years of experience teaching international curricula, including IB French B (SL & HL), French Ab Initio, AP Psychology, and IGCSE French, across leading IB and Cambridge schools.
Personalized IB tutoring with concept-focused learning approach.

Anish Chauhan
IB DP Physics • IGCSE Physics • Cambridge AS/A Level Physics | Former Academic Head
15 Years
Experience
1100+
Students
5
Rating
15+ years teaching IB DP, IGCSE, and Cambridge AS/A Level Physics
Achievements
Personalized IB tutoring with concept-focused learning approach.

Prem Raj Kumar
B.Sc. Computer Science | IB Educator Certificates | Google Certified Trainer
8+ Years
Experience
700+
Students
5
Rating
An experienced IB Computer Science educator specializing in Mathematics, ICT, and Computer Science across IB MYP, IBDP, IGCSE, AP, and A Level.
Personalized IB tutoring with concept-focused learning approach.
Grade Improvements — AP Score Results
From Students
ett
ett
Practice Tests & Past Exam Resources
Statistics Materials
Official Practice Tests
15+- ✓ Released College Board exams
- ✓ Scored answer keys
- ✓ Topic breakdowns
FRQ Bank
200+- ✓ Organized by unit
- ✓ Scoring rubrics
- ✓ Sample responses
Multiple Choice
500+- ✓ Unit quizzes
- ✓ Mixed practice
- ✓ Timed tests
Calculator Guides
25+- ✓ TI-84 tutorials
- ✓ Function walkthroughs
- ✓ Quick reference

All Resources Included Free
Every tutoring student gets unlimited access to our complete Statistics resource library
What students say
“I was scoring a 2 on AP Chemistry practice tests in January. By May I had a 5. Pooja ma'am focus on the FRQ rubric was the thing that made the biggest difference, I'd never understood how strictly it was marked.”

Amasha
Chemistry
“Prannoy sir helped me go from a 3 to a 5 in AP Calculus BC. The sessions were intense but the way he broke down FRQ justification was completely different from what my school taught. I finally understood what 'show your work' actually means for College Board”

Jiya
Calculus BC
Frequently Asked Questions
Everything About IB Statistics Tutoring
Our tutors guide students through identifying confounding variables, avoiding bias in surveys, and structuring completely randomized experiments or observational studies according to College Board standards.
Yes, we provide focused practice on calculating expected values, working with discrete and continuous random variables, and applying binomial and geometric formulas correctly.
We run intensive drills on past exam FRQs, training students on how to write precise statistical conclusions in context, check necessary conditions before performing tests, and tackle the multi-part investigative task.
Absolutely. Our lessons comprehensively cover exploratory data analysis, planning a study, probability/simulation, and statistical inference (confidence intervals and significance tests).
Yes, we break down the four-step inference process (State, Plan, Do, Conclude) for one-sample, two-sample, paired data, chi-square tests, and linear regression t-tests.
We teach students how to read software regression printouts to extract slope coefficients, standard errors, $R^2$ values, and p-values for hypothesis tests involving linear relationships.
Book Your AP Statistics Tutor Today
Start with a Free Trial Session
Book Free Trial
Choose your preferred time slot
Meet Your Tutor
Get matched with Statistics expert
Start Improving
Begin your personalized prep plan
No credit card required • No commitment • 100% satisfaction guarantee
1000+
Students Taught
4.8
Average Score
89%
Score 4 or 5
200+
Expert Tutors